
Prometheus
- About
- Open-source systems monitoring and alerting toolkit. Open-source alternative to Datadog.
- Catalogue
- No. 244
- Category
- Data & Content
- GitHub stars
- ★ 0
Overview
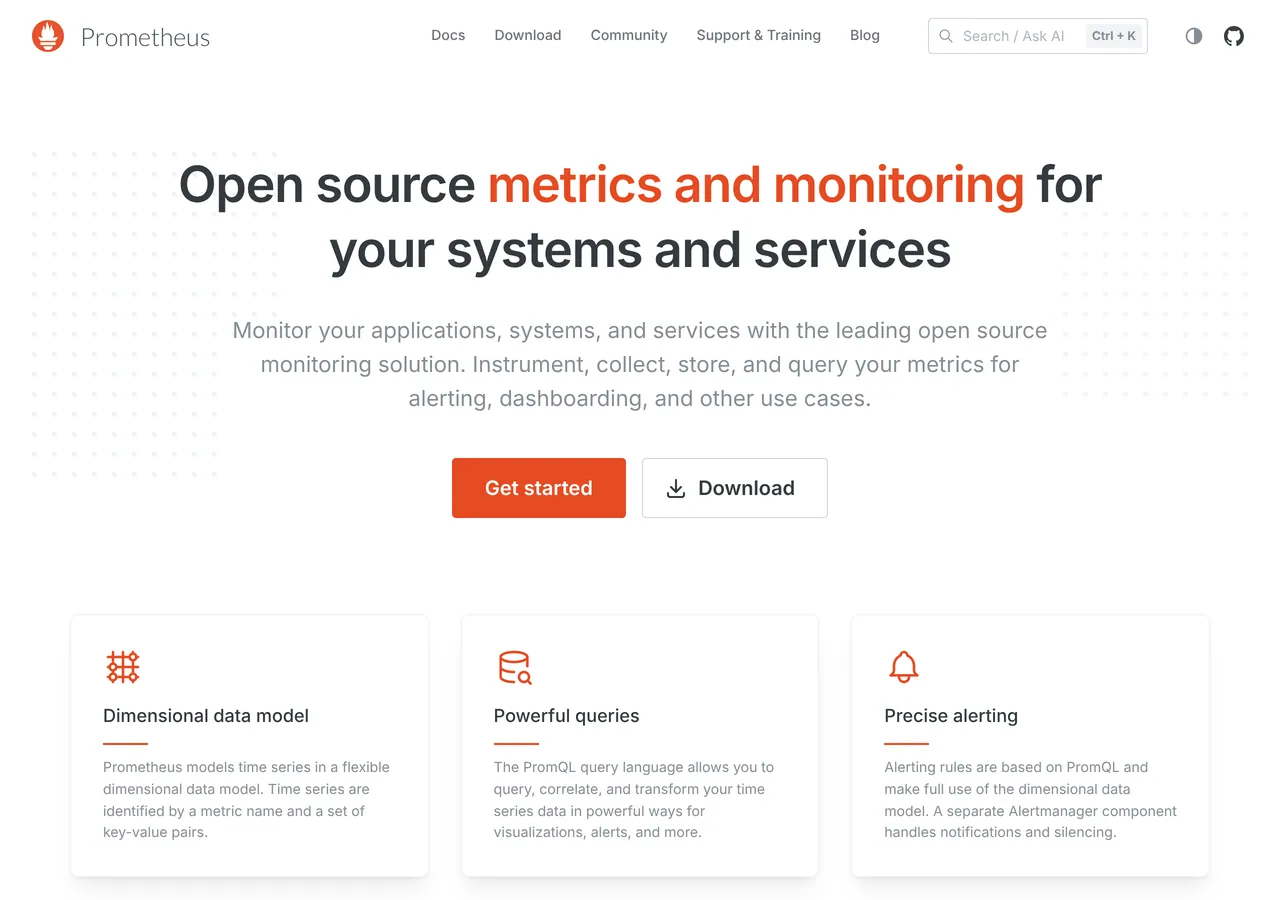
Prometheus is an open-source monitoring system and time series database, and a Cloud Native Computing Foundation project. It collects metrics from your applications and infrastructure at regular intervals, evaluates rules on them, and can trigger alerts when conditions are met.
What it does well
Prometheus stores metrics in a multi-dimensional data model, where each time series is identified by a name and key/value labels, and queries them with PromQL. Each server runs on its own without distributed storage, pulls metrics over HTTP, and finds targets through service discovery or static configuration. Short-lived jobs can push metrics through a gateway, alerting rules feed a separate Alertmanager, and it supports federation and several graphing options, most often Grafana.
Why it’s in the collection
Prometheus is the standard for metrics in the cloud-native world, and nearly every infrastructure tool exposes metrics in its format. It is Apache-licensed and governed by the CNCF.
On GitHub
- Stars
- 0
- Forks
- 0
- Commits
- 0
- Repository
- prometheus/prometheus
Languages
- Go 87.5%
- TypeScript 10.4%
- Python 0.8%
- Other 1.3%
Compared with
 DatadogHosted monitoring and observability platform, priced by usage.
 New RelicHosted observability platform, priced by usage.
 GrafanaNo. 004Open-source dashboards that are most often used to visualize Prometheus data.
See every open-source alternative to Datadog in the collection.